04
2019.11

On August 3, 2018, the Chinese government released a report detailing $60 billion worth of tariffs it had just imposed on more than 5,000 U.S. goods. Malcolm Scott, Asia Economics Editor at Bloomberg News, anticipated this kind of bombshell announcement after covering the escalation of trade tensions between China and the U.S. escalate following the election of President Donald Trump. But when the Chinese government released its report detailing which goods would be taxed, Scott and his team at Bloomberg News faced the tedious task of turning a list of 5,207 items – written in Chinese – into a news story.
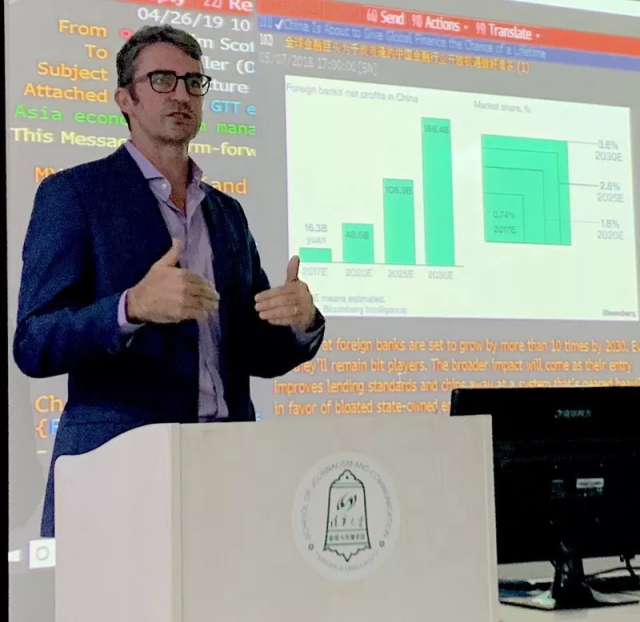
Speaking to Professor Lee Miller’s Data Mining class on April 26, Scott described how Bloomberg was able to break the trade war news story by using data analysis. A key player was then-intern Natalie Lung, who figured how to match items on the Chinese list to a key of the same commodities in English using an Excel spreadsheet function. That helped her translate the list in full instead of line by line, helping Bloomberg beat all other global news organizations to publish the full list of products first.
“Data analysis helped us generate news that no one else had,” Scott said.
Scott said data analysis allowed his team to turn a list of more than 5,000 goods into graphics that showed which commodities were hit with 25 percent tariffs –fish products, pine logs and wood pellets – and consumer goods that escaped tariffs, like laptops and cellphones. The creativity it took to rapidly decipher that trade report is the same kind Scott and his team at Bloomberg use every day to tell stories about the economy in Asia.
In his lecture Scott talked about how Bloomberg uses data to track changes on issues like global trade that happen over long periods of time. “Global trade isn’t something that happens on a computer screen,” he said. He showed the class a story where Bloomberg used shipping data to track trade frequency between the U.S. and China. While mining data is a big part of the process, Scott said it also comes down to choosing the right metrics to make that data useful.
“The numbers alone sometimes aren’t enough,” he noted.
That’s also why Scott said it’s important for business journalists to find the sweet spot between data and human details. Scott’s team wrote a story about Sarufutsu, a fishing village in Japan that, on paper, had the highest average income of any city in Japan. On the ground, Scott said, Bloomberg reporters found wealth was held by a few while most people in the town struggled to earn money. It’s a story that started with numbers but came to fruition through reporting on the ground. “[Data] is magic,” he said. “But you need the people too.”
Scott said business journalists should not just rely on data that’s readily available to the public. If they did, everyone would be telling the same stories, he said. Instead, Scott told the students he pushes his team to create projections with data that foreshadow where big stories will go, and encourages them to use graphics to make those stories interactive.
“Let’s do the hard stuff,” he said.
(Written by Betsy Joles, Edited by Rick Dunham)

2023.08.14 13:45
05
2025.09
05
2025.09
09
2025.06
 28:32
28:32
2025.06.19 08:55